

A letter from the President:
It’s tough to make predictions, especially about the future.
– Yogi Berra
My dad asked me a few weeks ago if he should exchange some US cash he holds into Canadian funds. He thought the US dollar was a little overpriced and would drop relative to the Canadian dollar. He wanted to know, but I couldn’t tell him. In fact, nobody can tell him. The foreign exchange market trades about $6.6 trillion every day. If we knew, we would be very rich.
Everyone wants to know when interest rates will drop, is the US dollar overpriced, is the S&P500 going up, and who will win the Super Bowl. No one can tell you. Last January, no one saw inflation hitting 8.1% (as it did in June) or the bank prime rate hitting 6.7% (as it did last week). The World Economic Forum in Davos just ended with 116 billionaires, multiple CEOs, the FBI Director, and over 60 politicians in attendance. The Forum engages political, business, and other leaders of society to shape global, regional, and industry agendas, but even they have failed to forecast a single major financial, political, or social event.
Predicting the future is hard.
Every January, portfolio managers sit down at their computers and write their annual forecasts. They don’t like to do it, but they do it because their readers want to know. In our October letter, we took a minor stab at predictions:
“We don’t like to predict the future as it’s a dangerous game but, seeing as you asked, here is, not our official position, but my own outlook:
- Short term. The outlook is Volatile. We will possibly see a further pullback and likely more of what we have seen so far this year, at least for a while.
- Medium-term, say the next 2 years: I’m reasonably positive. We are deeply into the Fed tightening cycle, equity and bond values have adjusted, and the market has priced in much of the bad news. We will see gains eventually; we just don’t know when. In the medium term I am guardedly optimistic.
- Long-term: I am strongly bullish. There is $5 trillion of cash on the sidelines in the US. North American growth remains decent, and I expect it will rebound strongly when the tightening cycle turns.”
I stand by these broad predictions, but the fact is we can’t know what lies ahead. Our inability to predict the future might lead you to ask: How can we do our job of building portfolios for our clients if we don’t know the future?
THE ZLC WEALTH APPROACH
We start with what we do know. We have identified and engaged select equity and fixed-income (bond) investment managers, who we feel are outstanding within their area of focus and who have strong track records over many market cycles. We also include specialized managers who focus on alternative assets and who give us exposure to real estate, private equity, and hedged investments. We strengthen the diversity of our portfolios using low-cost index funds focused on the most efficient parts of the market, such as large-cap Canadian and US equities and investment-grade bonds. We build our portfolios with appropriate diversity, we invest with conviction, we include small and midsized companies, have a value style bias (invest like a business owner, not a speculator), we do not overlook alternative strategies, we keep core fixed income conservative, and we invest rationally, not emotionally.
In our view, portfolios built on these principles will drive attractive risk-adjusted returns in the long term. We are passionate about building portfolios designed for each of our clients’ investment objectives and risk tolerance.
Investing should be more like watching paint dry or watching grass grow. If you want excitement, take $800 and go to Las Vegas.
– Paul Samuelson
UPDATED ON THE CHANGES AT ZLC WEALTH
We have been busy. Here is a rundown on some of the new and exciting developments we have or will be introducing at ZLC Wealth:
Quarterback is now up and running. Quarterback is the software that allows us to design and produce our own client statements.
Piersight, our new Client online portal was officially launched in October.
- Piersight gives you access to your account holdings, ZLC Wealth quarterly statements (produced by Quarterback!), and our President’s letter – all online, at any time.
- If you want, there’ll be no more paper! E-statements will be stored securely, and accessible 24/7. Permission-based electronic delivery of reports provides you with everything you need safely and securely.
- You should have received an email with instructions on how to access the portal and if you haven’t yet, we encourage you to sign on. If you need help accessing the site, please email us at [email protected]
EVOLUTION is our new Portfolio Management software. It has allowed us to move most of our accounts to “Fee-Based”. The Fee-Based program separates our management fee from the manager’s cost of each investment. The benefits of our new Fee-Based approach are:
- Transparency, as our fees are clear and disclosed on your statements.
- Establishes an advice-based relationship that supports our fiduciary responsibilities.
- Facilitates ongoing portfolio monitoring and rebalancing.
- Allows us to reduce your costs by using passive investments, such as exchange-traded funds (ETFs) in the parts of the portfolio where active stock picking rarely outperforms.
- A cascading fee schedule reduces your overall fee cost, in percentage, as your account value increases.
- Makes our fees fully deductible for taxable accounts.
Mako electronic forms go live in February! Mako is a fintech firm based in Montreal that is helping us prepare electronic forms and online signatures.
We hope you like the changes we are making! Our goal is to keep your costs the same or lower, while continuing to provide you with the outstanding portfolio management you have come to expect from our firm.
In his commentary below, Gareth Langdon has the uncomfortable job of walking you through the tough year 2022.
- Jon McKinney
2022 REVIEW: A YEAR TO FORGET
No matter how you slice it, 2022 was an eventful and rough year for the markets. Geopolitical tensions and negative externalities from the Russia-Ukraine conflict mixed with rising inflation resulted in a poor year for most asset classes. The S&P 500 was down just over 18% (total return), while the Global Aggregate Bond index was down over 16%. Canadian equities were able to outperform relative to the U.S. as the S& P/TSX Composite suffered a 6% loss. The first trading day of 2022 resulted in the S&P 500 hitting a new all-time high on January 3rd; not a bad way to start the year. However, this would be the highest the index would reach in 2022. Compare that to 2021 which saw the index hit new all-time highs 70 different times during the year.1 Equity markets rounded the year off by being positive in the fourth quarter, although there was no Santa Clause rally in December.
Of course, we have to take another peek at the latest inflation readings out of the U.S., which has prices rising 6.5% in the 12 months through December. A positive sign is that the overall consumer price index fell 0.1% from the previous month. Lately, inflation has continued to moderate from the high of 9.1% witnessed in June, which was the highest it’s been in four decades.
A good example to illustrate the volatile year we’ve experienced can be showcased by the fact that there were 219 days this calendar year where the S&P 500 index saw a 1% or greater intraday move, the most since 2009.
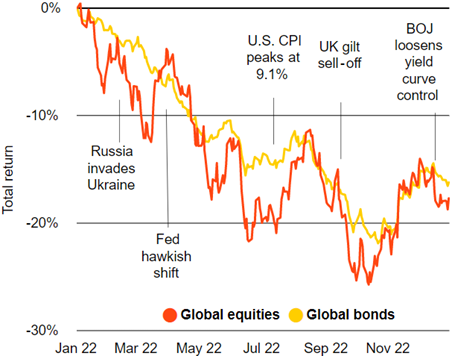
Bonds, which can often help offset equity losses in a portfolio, were not able to provide that much-desired support in 2022 due to interest rates rising as a consequence of the high inflation that developed over the year, putting downward pressure on bond prices.
At the start of 2022, the market had expectations the Fed would hike 75 basis points during the entire year. Some investors strongly believed the initial inflation we saw was merely “transitory” while others were in the opposite camp. The Fed ended up hiking interest rates 425 basis points during the year, taking the market by surprise.
There is no doubt that 2022 was a bad year for growth stocks, as they underperformed their value counterparts by a wide margin. In fact, value outperformed Growth by the widest margin on record.
The US Dollar Index (DXY) peaked in September, up nearly 20% for the year, and would have been its biggest annual gain ever recorded if it stayed at those levels. However, the DXY declined substantially and finished off 2022 with a gain of 8.2%, in part because of the idea that “peak inflation” was in the rearview mirror.
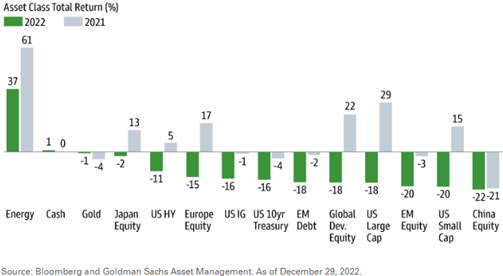
The below image gives a sample of various asset classes’ total returns for both 2021 and 2022. Only cash and energy were up over the past 12 months. Often after seeing certain asset classes perform well in a given period, it can be easy to assume that those returns are going to carry on into the future. Being too concentrated and chasing what is currently in favour, can be a risky game to play, especially if not properly diversified.
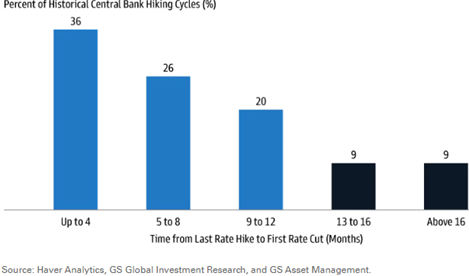
In October, the Bank of Canada hiked the overnight lending rate by 50 basis points, although this was less than the projected 75 basis points by most economists. The Bank hiked a further 50 basis points in early December to bring the benchmark overnight lending rate to 4.25%.
On the topic of rates, the below chart shows the frequency and time (in months) that central banks make their first-rate cut; 62% of the time a cut is made in 8 months or less from the last rate hike. That isn’t to say a rate cut this year is guaranteed, but it is certainly possible this calendar year.
Sources:
1 Miao, H., & Imbert, F. (2021, December 29). S&P 500 posts 70th record close, Dow rises for Sixth Straight Day. CNBC. Retrieved from https://www.cnbc.com/2021/12/28/stock-market-news-futures-open-to-close.html
2 Goldman Sachs Asset Management. (2023, January 4). Market pulse: Special edition – 10 for 2023. Market Pulse. Retrieved from https://www.gsam.com/content/gsam/us/en/advisors/market-insights/market-strategy/market-pulse/2023/market-pulse-jan23.html
3 Market Insights (2023, January 3). Global Weekly Commentary – Insights. Market Insights. Retrieved from https://www.blackrock.com/ch/professionals/en/insights/weekly-commentary
4 The Market Intelligence Desk Team. (2023, January 3). 2022 review and Outlook. Nasdaq. Retrieved from https://www.nasdaq.com/articles/2022-review-and-outlook
5 Goldman Sachs Asset Management. (2023, January 3). Market monitor: December 30. 2022 in Review. Retrieved from https://www.gsam.com/content/gsam/us/en/advisors/market-insights/market-strategy/global-market-monitor/2022/market_monitor_123022.html
6 Goldman Sachs Asset Management. (2023, January 4). Market pulse: Special edition – 10 for 2023. Market Pulse. Retrieved from https://www.gsam.com/content/gsam/us/en/advisors/market-insights/market-strategy/market-pulse/2023/market-pulse-jan23.html
7 Goldman Sachs Asset Management. (2023, January 6). Market monitor: January 6. New Year, New S&P 500? Retrieved from https://www.gsam.com/content/gsam/us/en/advisors/market-insights/market-strategy/global-market-monitor/2023/market_monitor_010623.html
8 Bilello, C. (2022, December 16). Investing Resolutions for life. Charlie Bilello’s Blog. Retrieved from https://bilello.blog/2022/investing-resolutions-for-life
DISCLAIMER: This newsletter is solely the work of the author for the purpose to provide information only. Although the author is a registered Investment as a Portfolio Manager at ZLC Wealth Inc. (ZLCWI), this is not an official publication of ZLCWI. The views (including any recommendations) expressed in this newsletter are those of the author alone, and are not necessarily those of ZLC Wealth Inc. The information contained in this newsletter is drawn from sources believed to be reliable, but the accuracy and completeness of the information is not guaranteed, nor in providing it does the author or ZLCWI assume any liability. This information is not to be construed as investment advice. Your own circumstances have been considered properly and that action is taken on the latest available information. This newsletter is not and under no circumstances is to be construed as an offer to sell or the solicitation of an offer to buy any securities. This information is given as of the date appearing on this newsletter, and neither the author nor ZLCWI assume any obligation to update the information or advise on further developments relating to information provided herein. This newsletter is intended for distribution in those jurisdictions where both the author and ZLCWI are registered to do business. Any distribution or dissemination of this newsletter in any other jurisdictions is prohibited. The rate of return shown is used only to illustrate the effects of the compound growth rate and is not intended to reflect future values of the Fund or returns on investment in the Fund. Commissions, trailing commissions, management fees and expenses all may be associated with mutual fund investments. Please read the offering memorandum or prospectus of the Fund before investing. The indicated rates of return are the historical annual compounded total returns including changes in unit value and reinvestment of all dividends and does not take into account sales, redemption, distribution or optional charges or income taxes payable by any unitholder that would have reduced returns. Performance results are not guaranteed, values may change frequently, and past performance may not be repeated.