By Jon McKinney
President & Portfolio Manager
President’s Letter Q3- 2025
From Microsoft to Magnificent 7
In the early days of my working life, I was having dinner with some friends, and we were talking about our career paths. One of the guys, Kyle, who was a “computer guy” in high school, was writing meal-planning software for Correctional Service Canada, but he figured he could do better. In his view, he needed to work for Microsoft, a growing company we’d barely heard of. Over dinner, he explained to us computer neophytes that the amazing thing about software – unlike say automobiles or dishwashers – was that once it was written, the revenue was virtually all profit. The cost of another copy is minimal. Forget plastics, software was where the money was!
Kyle ended up working at Microsoft where he is today in a senior role. To the point about making money, if he had bought just 100 shares of Microsoft just before its 1986 IPO (initial public offering), those shares would be worth $15 million today1! Kyle missed the IPO but after a 30-year career at Microsoft, he’s doing fine.

Bill Gates and Paul Allen in Microsoft’s Bellevue office, 1981. Photo by Jim Hallas
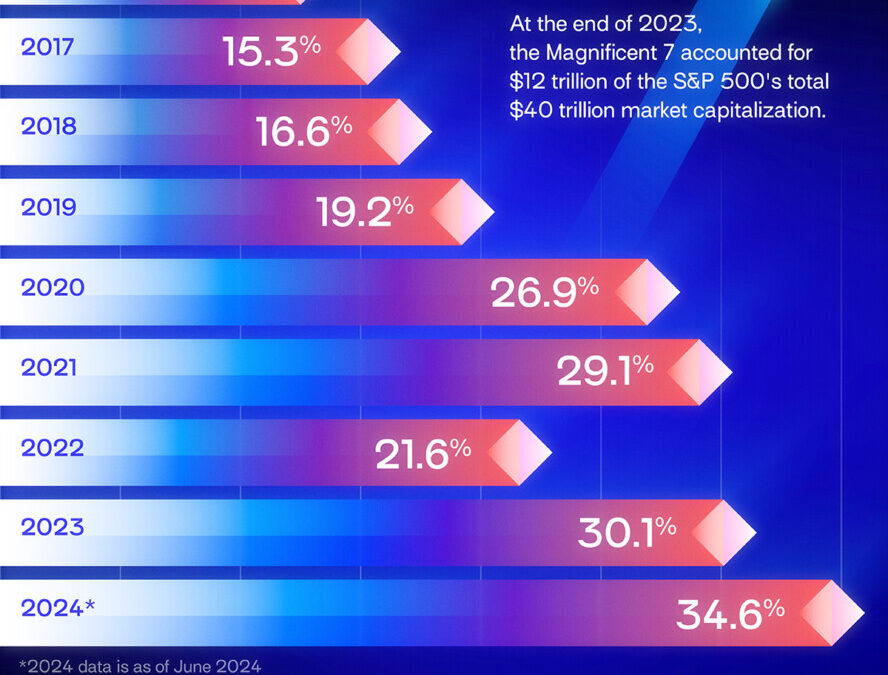
Microsoft was created while I was still in high school by Bill Gates and Paul Allen. It is now one of the “Magnificent Seven” (Mag 7) stocks, the seven big tech companies that everyone is talking about and that have driven the S&P 500 to its lofty heights. One thing to note about these “heights” is the S&P 500 index is calculated based on each company’s market capitalization, so bigger companies have a bigger impact.
A Trillion
The market capitalization of Microsoft is $3,900,000,000,0002. (I like to write it out to underscore how big it is.) Even though it’s just one of 500 companies in the index, Microsoft makes up 6.4%3 of the index. Nvidia is even bigger at 7.4%3. Together, the Mag 7 companies make up more that a third of the world’s biggest and most important stock index, the S&P 5003.

AMG National Trust, 2023 and then Magnificent 7, January 18, 2024
Artificial Intelligence
If we are concerned the S&P 500 index is highly valued, we should keep in mind its makeup. The driver of high market values for the Mag 7, and consequently the S&P 500, is a thesis that really started just over 2 years ago with the introduction of ChatGPT by Sam Altman’s OpenAI. (Fun fact: OpenAI is a private, non-profit company that is not even in the index!) The thesis is that Artificial Intelligence, or AI, is transformative and will lead to excess future profits across much of the economy but especially for those companies that are core to it, like the Mag 7.
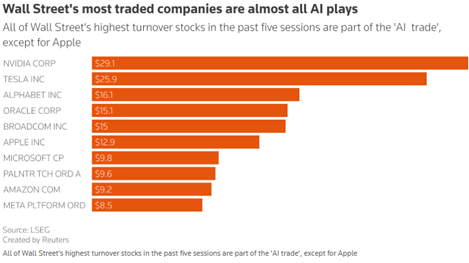
In fact, JPMorgan estimated that a basket of AI-related stocks accounted for 44% of the S&P 500’s total market cap as of October 2025, up from 26% in 20224. Some research suggests that AI-related stocks may have generated as much as 75% of recent S&P 500 gains5. Since October of 2022, the beginning of this bull market, the S&P 500 has gained over 80%, but the Mag 7 have gained over 200%. If you look at the S&P500 without Mag 7, the returns are a much more modest 60%.
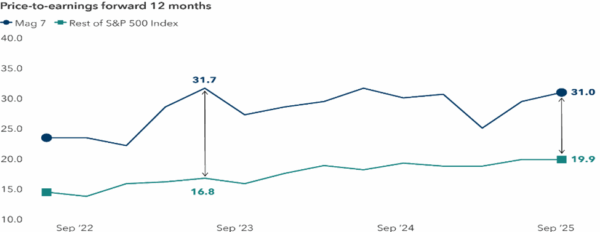
Mag 7 companies have a forward price/earnings (P/E) ratio of 31 while the other 493 companies are 19.9 (as of September) 7, much closer to their long-term averages. (Note: The “forward” P/E is the stock price divided by the consensus forward earnings estimate. A higher P/E means investors are willing to accept a lower return based on expected future growth.)
What can we predict from all this? Well, we could predict that AI will change the world (this I don’t doubt!) and it will drive profits for the Mag 7 companies that are well placed to take advantage (very likely). Alternatively, we could conclude that AI is over-hyped and many of these companies are over valued and won’t realize the future growth expected of them (very possible). We could also conclude that much of the market– the other 493 companies in the S&P 500, are reasonably valued in the growing $30 trillion US economy.
No Crystal Ball
The thing is, we don’t like to predict. That is why, while we have weight to the S&P 500 and consequently the Mag 7, we also have assets with a value-style manager of US equities, who holds less exciting companies, and we diversify our portfolios to include both passively and actively-managed Canadian, global and emerging market equities, Canadian and US actively-managed bond portfolios, and uncorrelated long-short strategies.
In other words, we don’t feel we can predict the future, so we don’t. We use appropriate diversification to protect our client’s portfolios. It’s boring but it seems to work.
Yin’s Quarterly Market Commentary – Q3 2025
The 3rd quarter of 2025 was full of changes. Markets reacted to new policies, political tension, and slowed global growth. Investors faced many mixed signals. Inflation went down in most areas, but not evenly. Interest rates dropped, but the economy stayed soft. Many investors are now asking what comes next.
The Bank of Canada cut its policy rate by 25 basis points to 2.5% in September. It was the first cut after months of no action and a further 25 basis cut is expected October 29. The decisions are based on slower inflation that is closer to the central bank’s target, and unemployment rose to 7.1%8, showing cracks in the labor market. The cut lowered borrowing costs and offered relief to companies and consumers, providing support to the market.

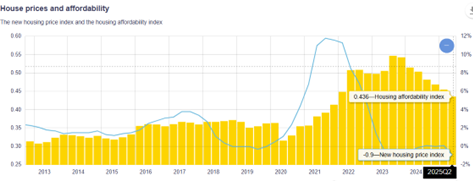
Real estate and infrastructure both benefited. Still, many challenges remain. Real estate developers face higher construction costs and tighter lending conditions. Mortgage rates are lower, but housing affordability remains poor. Buyers are cautious, and transaction volumes are not yet back to normal. Home prices have stopped falling but show little sign of recovery only9.
Politics played a major role as always. In the United States, the federal government shut down for several weeks. Essential services were disrupted, and many workers missed paychecks. Economists estimated that each week of shutdown could reduce U.S. GDP by $7 billion10.
Trade tensions also intensified. The U.S. reinstated tariffs on imports of lumber, furniture, and cabinets. These measures hurt global supply chains and added costs for manufacturers. Canada, as a close trading partner, was inevitably affected. Higher import costs may raise prices for building materials and furniture which further deteriorate affordability issues.
A clear gap still remains between the market and the economy. Economic growth has slowed. Business investment and consumer spending have weakened. Unemployment has risen significantly. Yet equity prices performed exceptionally well. This difference shows how markets often look ahead. Investors expect that lower rates will eventually support earnings and restore growth. They are betting on better conditions next year. However, valuations are already high, and expectations leave little room for disappointment.
The International Monetary Fund warned that markets have become “too comfortable”11. It noted that stock valuations look stretched and that sudden corrections are possible. This warning reminded investors that concentration in big name stocks could be dangerous.
Despite global noise, Canadian markets stayed relatively calm. Over the past five years, Canadian equities have performed better than both U.S. and international markets. Investors view Canada as a safe and predictable environment. Its stable political system and reliable financial sector make it attractive for long-term capital. Stability may not always create fast returns, but it often produces consistent ones.
Our equity allocation focuses on quality and consistency. We prefer investments that can adapt to changing environment. We invest in both Canadian and international markets to capture opportunities in multiple regions. We also use alternative strategies, such as Multi-strategies and Equity Long-short funds. These strategies help reduce the portfolio correlation to public markets and smooth out returns. When equity volatility rises, alternatives often provide balance.
This mix of assets aims to balance growth, income, and defense. It reflects our belief that no single asset class can perform well in every environment. A diversified, all-weather portfolio stands a better chance of sailing through uncertainty. Our goal is not to chase short-term rallies but to capture long-term opportunity with controlled risk.
Sources:
- Investment Calculator, Micosoft.gcs-web.com
- Yahoo Finance, October 24, 2025.
- com/sp500
- Yahoo Finance, ca.finance.yahoo.com/news/jpmorgan-estimates-30-ai-stocks-002748513.html Fortune.com/2025/10/07
- Yahoo, Markets Live Broadcast, Samuel O’Brient, October 17, 2025
- S&P Global, www.spglobal.com
- Capital Group, October 17, 2025, FactSet
- com/canada/unemployment-rate
- bankofcanada.ca/rates/indicators/capacity-and-inflation-pressures/real-estate-market-definitions/
- theguardian.com/business/2025/oct/02/government-shutdown-cost-economy-billions
- reuters.com/business/finance/imf-warns-rising-odds-disorderly-global-market-correction-2025-10-14/#:~:text=WASHINGTON%2C%20Oct%2014%20(Reuters),Monetary%20Fund%20said%20on%20Tuesday.
Disclaimer:
This newsletter is solely the work of the author for the purpose to provide information only. Although the author is a registered Investment as a Portfolio Manager at ZLC Wealth Inc. (ZLCWI), this is not an official publication of ZLCWI. The views (including any recommendations) expressed in this newsletter are those of the author alone, and are not necessarily those of ZLC Wealth Inc. The information contained in this newsletter is drawn from sources believed to be reliable, but the accuracy and completeness of the information is not guaranteed, nor in providing it does the author or ZLCWI assume any liability. This information is not to be construed as investment advice. Your own circumstances have been considered properly and that action is taken on the latest available information. This newsletter is not and under no circumstances is to be construed as an offer to sell or the solicitation of an offer to buy any securities. This information is given as of the date appearing on this newsletter, and neither the author nor ZLCWI assume any obligation to update the information or advise on further developments relating to information provided herein. This newsletter is intended for distribution in those jurisdictions where both the author and ZLCWI are registered to do business. Any distribution or dissemination of this newsletter in any other jurisdictions is prohibited. The rate of return shown is used only to illustrate the effects of the compound growth rate and is not intended to reflect future values of the Fund or returns on investment in the Fund. Commissions, trailing commissions, management fees and expenses all may be associated with mutual fund investments. Please read the offering memorandum or prospectus of the Fund before investing. The indicated rates of return are the historical annual compounded total returns including changes in unit value and reinvestment of all dividends and does not take into account sales, redemption, distribution or optional charges or income taxes payable by any unitholder that would have reduced returns. Performance results are not guaranteed, values may change frequently, and past performance may not be repeated.
IMPORTANT INFORMATION: The above commentary may contain an update on certain funds offered through ZLC Wealth Inc. Returns are net of fees and include reinvested dividends. The performance of the fund presented in this document may be for a different series of fund than the series that you hold in your account. The performance of the series that you hold may be different than what is shown. This information does not constitute an offer or solicitation to anyone in any jurisdiction in which such an offer or solicitation is not authorized, or to any person to whom it is unlawful to make such an offer or solicitation. These products may not be appropriate for all investors. Important information about the funds is contained in the offering documents which should be read carefully before investing. You can obtain these documents from ZLC Wealth Inc. Please speak to a ZLC Wealth Portfolio Manager or Representative to determine if these products are right for you.