
Letter from the President:
A TALE OF TWO MARKETS
In my grade 10 year in high school, I struggled through Charles Dickens’ A Tale of Two Cities, but I read it again a few years ago and loved it. So last month, to give me a break from COVID, I opened it again.
The first sentence of the book, which speaks of the period just before the French revolution and is probably one of the most quoted passages in literature, always seems to sum up what is going on in the world, but today in the age of Trump and the Virus it seems even more poignant:
“It was the best of times, it was the worst of times, it was the age of wisdom, it was the age of foolishness, it was the epoch of belief, it was the epoch of incredulity, it was the season of Light, it was the season of Darkness, it was the spring of hope, it was the winter of despair, we had everything before us, we had nothing before us, we were all going direct to Heaven, we were all going direct the other way – in short, the period was so far like the present period, that some of its noisiest authorities insisted on its being received, for good or for evil, in the superlative degree of comparison only.” (A Tale of Two Cities, Charles Dickens, 1859)
Don’t we live in the period of “superlative degree of comparisons only”? If you’re in doubt, re-watch the US presidential debates!
In the heart of a pandemic, as we head toward the US election, and with many asset prices close to record levels – especially the big growth stocks (aka FAANG – Facebook, Apple, Amazon, Netflix and Google, or sometimes FANMAG to include Microsoft and even FATMAN to include Tesla) – many are asking: Is today the best of times or the worst of times?
Lacy Hunt, of Hoisington Investment Management of Austin Texas, tends to see things as closer to “the worst of times”. In his recent second quarter letter he wrote:
“…additional debt incurred by all countries, and many private entities, to mitigate the worst consequences of the pandemic, while humane, politically popular and in many cases essential, has moved debt to GDP ratios to uncharted territory. This insures that a persistent misallocation of resources will be reinforced, constraining growth as productive resources needed for sustained growth will be unavailable.” (Quarterly Review and Outlook, Second Quarter 2020, Van R. Hoisington, Lacy H. Hunt, Ph.D.)
Closer to the “best of times” thinking is one, who in March this year correctly forecast a V-shape market recovery, Simon Ward of Janus Henderson of the UK. This month he wrote:
“The global economy has rebounded strongly as virus control measures have been eased, with industrial output on course to exceed its pre-COVID level in Q4 2020. Major central banks have ignored this positive surprise, locking themselves into multi-year maintenance of ultra-loose policies. Fiscal authorities, similarly, are fearful of winding down stimulus. The global broad money stock is far above its estimated “equilibrium” level, implying medium-term upward pressure on asset prices, economic growth and goods and services inflation. Economic and market commentary remains focused on virus developments to the neglect of arguably more significant monetary and cyclical drivers. Global new cases were easing off in early October, while the European “second wave” – exaggerated in the data by increased testing – appeared to be peaking.” (A “monetarist” perspective on current equity markets, Simon Ward, October 4, 2020.)
If you think some valuations are high now, they can get higher still. Equities are valued by discounting estimated future cash flows using a certain discount rate. With interest rates now at or close to historical lows and expected to stay low for longer, the current discount rate fully justifies the current average price/earnings or P/E ratios in the market, even though they are higher than historic averages.
In our view, equity markets, while they will continue to be volatile, will unlikely re-test the March 2020 lows. Volatility is reasonably high this quarter and it may get worse as we go through a US presidential election that may hold a third “option” – Biden or Trump or a Supreme court battle! But we need to look beyond the volatility and the US election. The stock markets tend to look at two things: interest rates and economic growth. We think both look favorable.
If volatility scares you consider that if you bought the S&P500 at its peak before the last financial crisis, on October 9, 2007, and held it until August of this year, you would have made 8.7% annually (including dividends) despite the financial crisis, two recessions, two bear markets, and six corrections.
As you should have heard from us many times over the years, our guidance for investors is to take a long term view, have reasonable diversification across strategies and holdings, use managers who pay attention to value (value style), and be rational not emotional.
Joshua Brown – Quarterly Commentary
WHAT HAS HISTORY TAUGHT US?
Over the last 20 years, the average equity mutual fund returned 8% annually. The average investor returned 4% annually, in those exact same investments. The mistakes investors are making costing them 4% a year.1
I made my first stock market investment when I was still in University. Being a poor student, money was tight. I worked hard and finally saved $12,000. I was rich! It was time to get my money to start working for me. I had friends who were making money in the stock market and it looked like a good place to start. One day while sitting in my Simon Fraser University (SFU) finance class, I decided it was time to start investing my money. With my MacBook open, I looked at some stocks a friend had recommended. I spent a few minutes looking at their past trading prices and invested my savings into three speculative companies. I spent more time picking out my $5 lunch after class than I did with my $12,000 investment. My investment was supposed to double in a few months. I was excited to sit back and watch my money grow.
Over the next six months, that $12,000 turned into $3,000. It isn’t easy to lose 75% of your money in half a year. It’s not a skill that you brag about at Thanksgiving dinner. But as I reflect on that day at SFU, I am thankful. I learned my first investing lesson. Invest wisely to build your long-term wealth. Investing foolishly, like I had, would destroy it. Learning that lesson when I was older, when I had more money would have cost me much more.
‘History doesn’t repeat itself, but it often rhymes.’ – Mark Twain
We are predictable. We have the same biological make-up as our ancestors, causing us to make the same mistakes as they did. With new generations history is easily forgotten. As we start our lives, we have no experience and have nothing to reference. We rely on our parents and our environment to teach us about the world. Along the way, we make mistakes and that is a part of growing up. As we gain more life experience, we become wiser and have a better understanding of how the world works. Our parents and grandparents will watch us make similar mistakes they had. In turn, we will watch our kids do the same. History is repeated.
With enough time, a new generation of investors will enter the stock market. They are young and inexperienced. They possess little knowledge of the past. Like me, sitting at SFU, making my first investment…The new generation will make the same mistakes their parents did. They will follow what their friends are doing, jumping into speculative investments, chasing the best performing companies, getting caught up in new and exciting investment trends and trying to time the market. They will end up paying much more for investments than they are worth and harm their long-term returns.
Imagine you are 45 years old with $500,000 in your retirement account. Making the same mistakes the average investor makes will cost you 4% per year. Those mistakes will have cost you a million dollars at retirement.
By studying history, we can learn and avoid the mistakes of previous generations.
The Nifty 50.
In the 1970’s, a new investment trend emerged. Buy and hold strong, stable Blue-Chip companies. Companies that had a long-term track record of consistent growth. These companies became known as the Nifty 50 and they became the fifty most popular stocks in the 70’s.
Investors jumped into these popular stocks. In 1972, investors were buying companies such as Polaroid, Avon Products, and Walt Disney. Based on the prices they were trading at; investors were paying 3-5X more for these companies than they were for the average stock2. It was like paying $6.00 for a litre of gas when it was selling for $1.20/litre at other gas stations. Investors didn’t care though. These companies were positioned for strong, long-term growth. Investors justified paying more for them.
A few years later these companies started trading at their fair value. Polaroid fell 91%, Avon fell 86%, and Walt Disney fell 84%. Investors lost virtually everything. The 70’s taught investors a valuable lesson. Overpaying for a company, no matter how good it was and how bright the future, was a bad strategy.
The Internet Bubble.
Thirty years later, a new generation of investors emerged. The new investment trend of 2000 was the Internet. It was changing the world. Emails replaced mail. We could shop from home in our pajamas. For the first time in human history, we virtually had all information at our fingertips. Investors began selling their slow growing, boring companies to buy exciting, new, and fast-growing internet stocks.
As more investors got excited, they bid up prices of internet stocks to extremely high levels. At its peak, investors in the Nasdaq were paying 13X more than the long-term average price they paid for stocks3. Instead of paying $6.00/litre for gas when it is $1.20, investors were paying over $15.00. Investors justified these prices, because they expected tremendous growth from these companies.
Just like in 1972, again investors overpaid for their investments. Some companies would go bankrupt, Pets.com, WorldCom, and Boo.com. Investors lost everything. Others would go on to change the world. Companies like Cisco, Amazon and Apple. But no matter how good these companies were, investors lost a lot of money by overpaying for them. Cisco fell 86%, Amazon 94%, and Apple 62% in a few short years.
2020, the FAANG Stocks.
Today, we have a generation of new investors. They haven’t heard of the Nifty 50. They didn’t participate in the Internet Boom. They are getting caught up in new investment trends and not paying attention to the inflated prices they are paying for these companies. Instead of buying the largest companies in the 1970’s such as Polaroid, Avon and Walt Disney. They are buying the largest and most popular companies today. Apple, Amazon, Microsoft, Google (Alphabet), Netflix and Facebook (the FAANG stocks). Like the Nifty 50, these are some of the most loved stocks and have been the best growing companies.
Investors again have justified the high prices that they pay for these stocks based on their future growth. On average, these stocks trade at 4X the historical valuation of the average stock.4
Investors in the 1970’s and in 2000 can tell you how that turned out. Not well. No matter how good the company, overpaying for them has been a losing strategy.
It’s worth repeating. ‘‘History doesn’t repeat itself, but it often rhymes.’ – Mark Twain
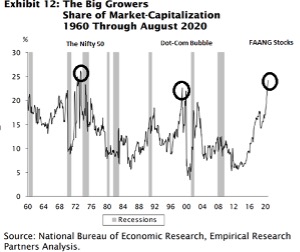
In the past, when an investment trend becomes popular, more and more investors pour money into it. The money goes into a few companies, and they become even larger. The market then becomes heavily weighted to just a few companies. Currently, Apple is now worth as much as the all the stocks in Germany, combined.5
In the chart below, during 1970 (the Nifty 50), growth companies became close to 25% of the market before they crashed. In the Dot-Com Bubble in 2000, the same thing happened. The FAANG stocks now make up 25% of the US markets. We have seen this before.
The US Presidential Election
Investors are worried about the US presidential elections. A majority of investors have opted to sit on the sidelines and hold onto cash until they see things get better.
Biden. Trump. Who will win? Currently the polls and the markets think Biden will win. Regardless of the outcome, US stocks have returned 10.2% in the year following the primaries. This compares to just 5.8% in non-election years. It doesn’t matter which party wins; the returns have been evenly distributed between both Democratic and Republican presidents. In the last 80 years, there have only been two negative years during election years. Both can be attributed to asset bubbles, rather than election results. These were in 2008 during the Financial Crisis and 2000 during the Dot-Com boom.6
Cash, It Doesn’t Pay Much
As I highlighted in my last newsletter, one-third of investors over the age of 65 sold all their stocks around COVID-19 concerns and are sitting on cash. Central banks have driven interest rates to virtually nothing for cash. Investors are still sitting on record cash balances that need to get back to work.
I recently spoke with a friend who lives in the United States. He has $40,000 sitting in a Chase Savings Account. Guess how much interest he earned in the last three months? $1.50. Maybe he can buy a slice of pizza. Retirees who have large amounts of cash sitting in the bank, can’t live off the interest. $100,000 would yield $15 of yearly interest.
We are finding many attractive investments out there, yielding anywhere from 3-6%. Not only that, these companies are growing their earnings and dividends over time. This is a much better return than a savings account that pays almost nothing.
In the financial crisis back in 2009, investors sold record amounts of stocks and were sitting on cash, just like today. Low interest rates forced investors back into the stock market. The S&P500 returned over 400% as cash flowed back in the US markets over the next 11 years.
The record cash balances that investors are sitting on will flow into the stock markets to earn higher returns. Recently, we have seen market weakness trigger investor buying; evidence that investors are starting to get cash back to work.
What Should Investors Do?
The stock market performance this year has not been evenly distributed. The largest companies have attracted the most money from investors. These include companies such as Apple and Tesla.
This has made the largest, most familiar companies in the world more expensive. Value companies have been sold and investors have used the funds to buy growth companies. Small companies have seen the most selling. At the end of the second quarter, the difference was striking. The ten largest companies in the S&P500 had close to a 50% difference in performance vs the smallest 50 companies for the first six months of 2020.
This has led to tremendous opportunities in the market right now for investors who do their homework. However, investors need to be very selective in this uncertain environment. Future returns depend on the prices being paid today. Paying too much, as we have learned in the past, will hurt long-term returns. Buying good companies at attractive prices will lead to above average future returns.
Our portfolios are very well positioned for the future. We have increased yields on our fixed income. The valuations for our stocks are well below where they have historically traded. We see strong future returns based on the incredible valuations on our portfolios. We were well prepared and handled the sell-off in March very well. Our alternative and fixed income exposure held up, and we re-balanced within our equity space to capture the extreme mispricing. We are well positioned as cash comes back into the markets.
In these very uncertain times, proper portfolio positioning is key. Investors who were not positioned properly prior to COVID-19 learned a hard lesson this year. Going forward, positioning is even more important to capture long-term future returns. I would be happy to provide a no obligation review, and some of the risks you may have in your portfolio. There has never been a better time for a review.
We hope you and your families are keeping safe and healthy and know we are here for you. Please don’t hesitate to reach out to me if you have any questions relating to your portfolio or the markets.
Kind Regards,
Joshua Brown, BBA, CFA
Vice President & Portfolio Manager
1 DALBAR
2 Price to Earnings (P/E) Ratio for Polaroid 91, Avon Products at 65, and Walt Disney at 86. The average P/E Ratio for a stock in 1972 was 19. https://www.usatoday.com/story/money/business/2014/04/01/ozy-nifty-50-stocks/7156447/
3 At its peak, the Nasdaq traded at a P/E ratio of over 200, well in excess of the long-term average P/E ratio of the US stock markets of 15 since 1870
4 https://www.marketbeat.com/types-of-stock/faang-stocks/
5 Source: Credit Suisse
6 capitalgroup.com/content/dam/cgc/tenants/canada/pdf/en/public/Guide_to_investing_in_a_US_election_year_EL.pdf
DISCLAIMER: This newsletter is solely the work of the author for the purpose to provide information only. Although the author is a registered Investment as a Portfolio Manager at ZLC Wealth Inc. (ZLCWI), this is not an official publication of ZLCWI. The views (including any recommendations) expressed in this newsletter are those of the author alone, and are not necessarily those of ZLC Wealth Inc. The information contained in this newsletter is drawn from sources believed to be reliable, but the accuracy and completeness of the information is not guaranteed, nor in providing it does the author or ZLCWI assume any liability. This information is not to be construed as investment advice. Your own circumstances have been considered properly and that action is taken on the latest available information. This newsletter is not and under no circumstances is to be construed as an offer to sell or the solicitation of an offer to buy any securities. This information is given as of the date appearing on this newsletter, and neither the author nor ZLCWI assume any obligation to update the information or advise on further developments relating to information provided herein. This newsletter is intended for distribution in those jurisdictions where both the author and ZLCWI are registered to do business. Any distribution or dissemination of this newsletter in any other jurisdictions is prohibited. The rate of return shown is used only to illustrate the effects of the compound growth rate and is not intended to reflect future values of the Fund or returns on investment in the Fund. Commissions, trailing commissions, management fees and expenses all may be associated with mutual fund investments. Please read the offering memorandum or prospectus of the Fund before investing. The indicated rates of return are the historical annual compounded total returns including changes in unit value and reinvestment of all dividends and does not take into account sales, redemption, distribution or optional charges or income taxes payable by any unitholder that would have reduced returns. Performance results are not guaranteed, values may change frequently and past performance may not be repeated.
IMPORTANT INFORMATION: The above commentary may contain an update on certain funds offered through ZLC Wealth Inc. Returns are net of fees and include reinvested dividends. The performance of the fund presented in this document may be for a different series of fund than the series that you hold in your account. The performance of the series that you hold may be different than what is shown. This information does not constitute an offer or solicitation to anyone in any jurisdiction in which such an offer or solicitation is not authorized, or to any person to whom it is unlawful to make such an offer or solicitation. These products may not be appropriate for all investors. Important information about the funds is contained in the offering documents which should be read carefully before investing. You can obtain these documents from ZLC Wealth Inc. Please speak to a ZLC Wealth Portfolio Manager or Representative to determine if these products are right for you.